


… just when I thought I’ve heard enough of the sciences in high school.
Does data have science too?
What exactly is it about?
In this short article, I would dissect the areas of Data Science into simple and understandable terms.
Data Science: Definition
Data Science is an aspect of computer science that uses various techniques such as statistical methods, computing algorithms, etc to get insights from unstructured data and make valuable predictions for various applications.
Data Science plays a great role in Artificial Intelligence. It can be done using Python, R, Julia, and so on, with Python being the most commonly used language, Although there’s a popular mix-up between Data Analysis and Data Science, after reading this text, I hope you’d understand the difference.
Before I go further, let me make a brief stopover at Machine Learning
Machine Learning
Machine Learning is a process of computer learning events or data in order to make valid decisions without human interaction. Machine Learning processes are referred to as models or algorithms which are employed in learning the behavior of certain patterns in a given data.
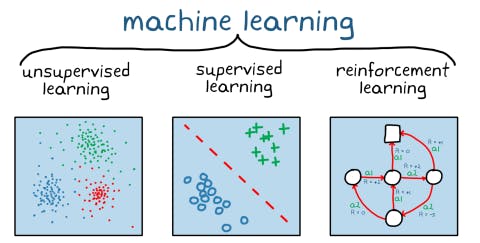
Machine Learning is broadly categorized into 3 types of learning:
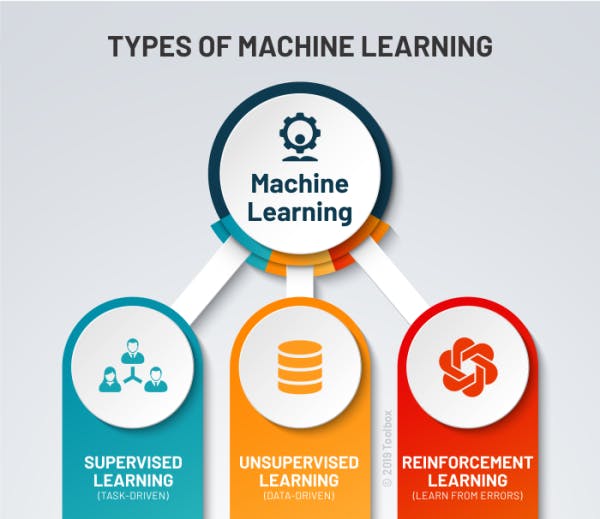
- Supervised Learning: This is a type of machine learning that maps input data to output data., in order words, every input data has labeled output data.
- Unsupervised Learning: It is the learning model without labeled data i.e it learns without supervision.
- Reinforcement Learning: This involves obtaining maximum reward through the learning of the environment's behavior. The more the model learns, the more it is rewarded, it's more like the more practice, the better but care has to be taken to avoid overfitting of the model.
Now that you have a hint of Machine Learning methods, let's concentrate on the reason for this article which is Data Science!
Data Scraping
To analyze or give any valuable prediction, you need data to work with. Such data is saved in various locations that require accessing them with few lines of codes.’ The first step in Data Science is getting the data, which means fetching your data from whatever location it is. It could be on your local machine as a CSV or excel file. It could also be on the web and be located by a URL; these practices are referred to as Data Scraping.
Although there are frameworks that can help import your data directly to your notebook or text editor, learning the tricks of data scraping proves to be more effective.
*Sample codes to import data in .txt  format*
import pandas as pd
import numpy as np
import re
import dateutil
from collections import Counter
with open ('name.txt', 'r', encoding="utf_8") as file:
    data_file = file.read()
data_file
*Codes to import data in a CSV file in python*

import pandas as pd
my_df = pd.read_csv (r'location of CSV\File name.csv')
print (my_df)
Code to import data from the web
import requests
url = input('www.name of webpage.domain ')
output_name = input('html name of file: ')
req = requests.get(url, 'html.parser')
with open(output_name, 'w') as f:
    f.write(req.text)
    f.close()
Data Analysis
Also referred to as Exploratory Data Analysis (EDA), It means taking a deeper look into the data to confirm the quality of the data i.e if it is properly structured and contains the necessary information. Data Analysis involves various statistical methods (including feature engineering) carried out on the data to make it clean and usable for modeling for prediction. Frameworks like Power BI and Tableau make Data Analysis quite easier and less stressful but in python, different methods such as dropna() are used to clean the data.
During Data Analysis, the Analyst ensures to make inferences from the cleaned data using the relevant rows and columns. There are different kinds of data analysis each for a specific purpose, Predictive Data Analysis, Descriptive Data Analysis, Diagnostic Analysis, and Prescriptive Analysis.
Code sample of data analysis using file imported in csv
import re
import pandas as pd
data_found= re.findall('(\d+/\d+/\d+,\s+\d+\:\d+)\s+\-\s(\w+\s\w+\s\w+|\w+\s\w+|\w+)\:(.*)', data_file)
df=pd.DataFrame(data_found,columns=['DateTime','Sender','Message'])
df.describe()
Data Visualization
Analyzing your data may not give the real expression or insight intended, remember that you easily assimilate what you see more than what you hear, this is more reason to put your analysis in a pictorial view.
Data Visualization tells the story of data in picture form and makes it easier for anyone to quickly understand what is being analyzed in the given data.
After analyzing your data, the next step is to view the analyzed data through various visualization patterns available in your chosen programming language or framework. In Python, data can be visualized in histograms, bar charts, scatter plots, Matrix, and what have you.
The aim of Data Visualization is not necessarily for aesthetics but to pass knowledge in the fastest and shortest way possible.
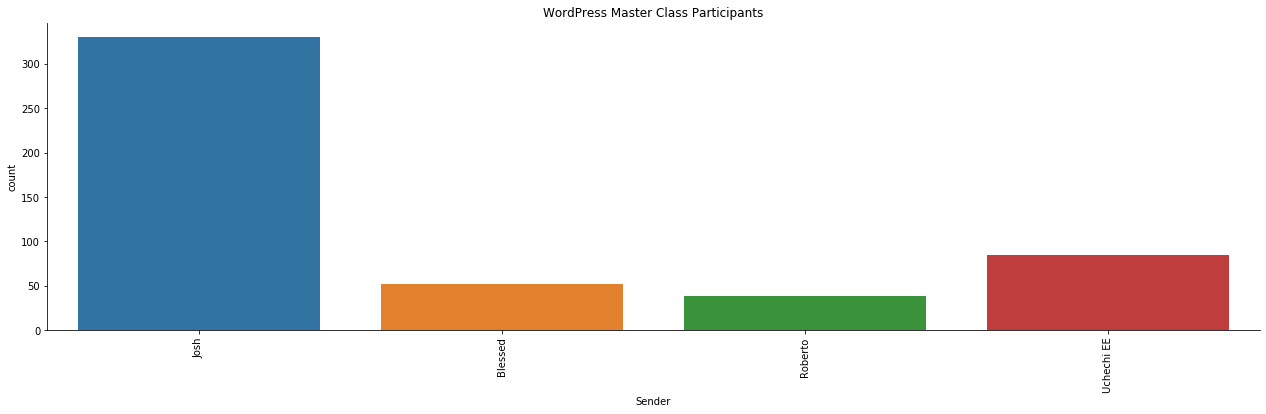
For instance, in the data visualized below: with little or no explanation, you could easily point out the student with the highest number of chats in the WhatsApp group.
Code sample for data visualization in python
import matplotlib.pyplot as plt
%matplotlib inline
import seaborn as sns
plt.figure(figsize=(20,30))
member_plot=sns.factorplot("Sender", data=df, aspect=3.5, kind="count")
plt.title('WordPress Master Class Participants')
member_plot.set_xticklabels(rotation =90);
Model Training
The essence of getting data is not merely to analyze and display it in beautiful color on a screen through data visualization but to make knowledgeable insights and recommendations that can be used as solutions in a particular field, industry, and the like. This is where Machine Learning Algorithms come to play.
When you are done visualizing your data, the next step is to split your data into two sets: one set known as training dataset and the other set known as test dataset.
Choosing an ML algorithm to train your data on, depends on the kind of data you are working on and the end result you seek. For supervised learning, you can use the Logistic Regression Model, Decision Tree, Naives Bayes etc For unsupervised learning, you can use K-Means Clustering, Anomaly Detection, etc. Your chosen ML algorithm is used on the training set and the outcome is watched or observed.
Model Deployment & Evaluation
After getting satisfactory outcomes during model training, the model is then deployed using the test data set. The reason for this is to check the performance and validate the ability of your chosen ML algorithm to new data.
While this is being done, some evaluation metrics are also being carried out on the model. Some of these metrics include Confusion Matrix (i.e how many times did your model confuse a false value to be true and vice versa), F1-Score, etc.
Conclusion
Data Science is worth pursuing as a career especially if you have basic knowledge of statistical methods and hands-on programming skills.
Now that you've learned the basic practices, you can choose one of the many courses available to broaden your knowledge of Data Science.
Remember, with constant practice, you'd become more skillful in any or all of the practices listed in this article.